What is the SVG Donut Chart Generator?
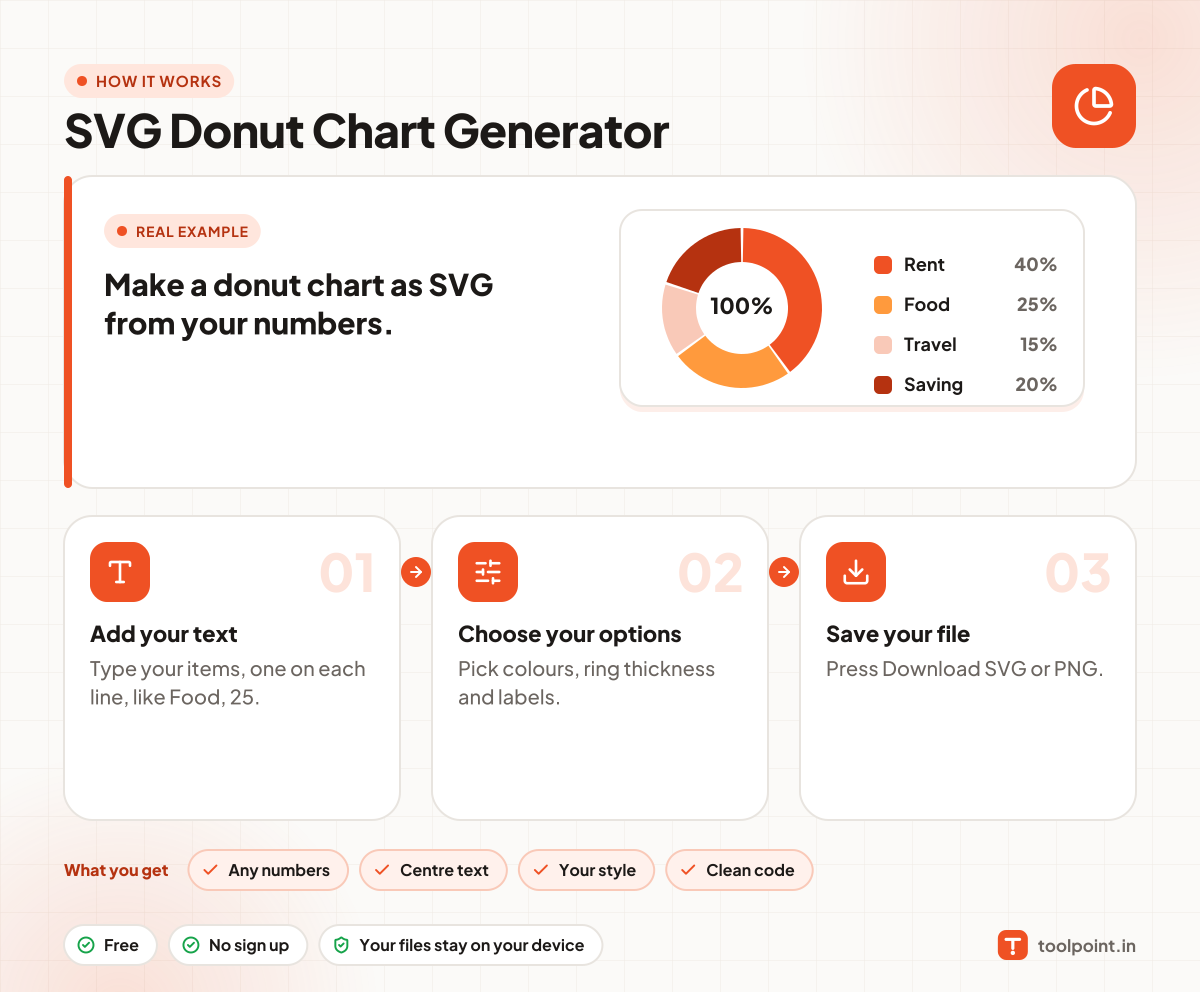
A donut chart shows how parts make a whole. Type your items, one on each line with a name and a number, and the chart is drawn at once, built with simple SVG circles and stroke-dasharray.
The numbers do not need to add up to 100. Slices are worked out as a share of the total. Choose colours, ring thickness, gaps between slices, round ends, percent labels, a key and text in the middle.
How to use it
- Type your items, one on each line, like Food, 25.
- Pick colours, ring thickness and labels.
- Press Download SVG or PNG.
Why people like this tool
Any numbers
Slices are a share of the total.
Centre text
Add a big number in the hole.
Your style
Colours, gaps and round ends.
Clean code
Small SVG with hover titles.